Reading the Climate Signals
Block-by-block heat mapping reveals where temperatures spike, often in asphalt-heavy districts with few trees. In one summer campaign, residents carried sensors on evening walks and discovered a ten-degree difference between shady parks and bus stop intersections. Share your neighborhood’s hottest spot so we can visualize the gaps together.
Reading the Climate Signals
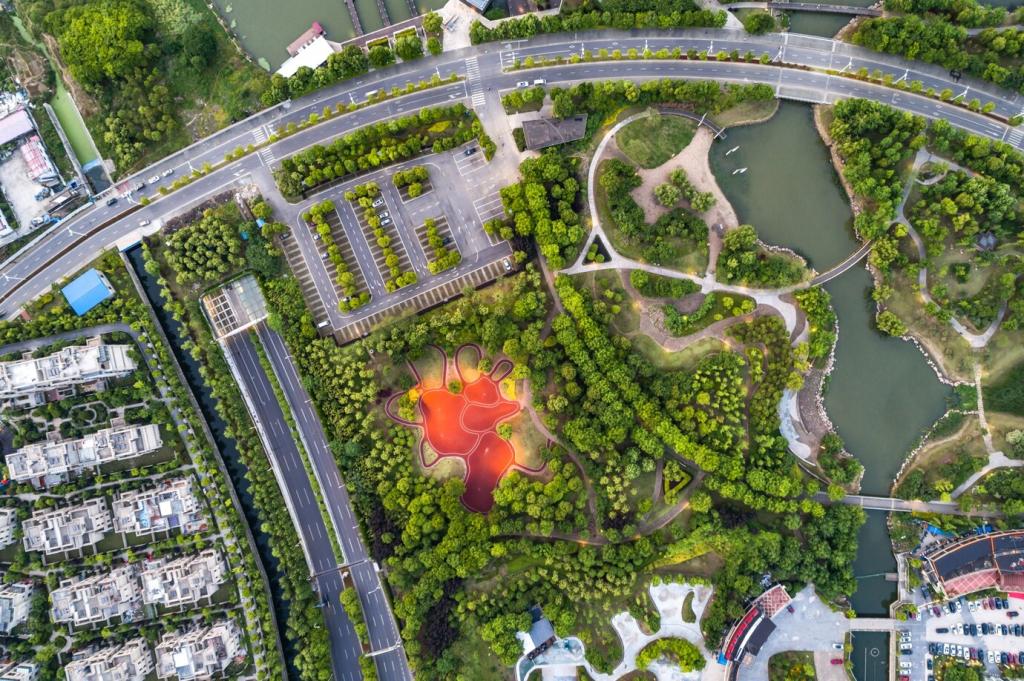
Layering storm surge, rainfall intensity, and drainage capacity helps pinpoint streets that drown first. A coastal town restored its floodplain after storms repeatedly swamped homes; the next season, high water lingered for hours instead of days. Tell us where puddles persist after every rain, and we’ll map priority fixes.